Shape
Copyright David & Cynthia Thomas, 2009
Points, Segments and Lines--Concepts and Connections
Directed Activity Plotting Points. The development of a coordinate system for identifying points in the plane revolutionized the study of geometry and motivated important advances in many other branches of mathematics. In a Cartesian Coordinate System, named in honor of the French mathematician Rene Descartes, two perpendicular lines define a frame of reference. Each of these lines is called an axis. By convention, one of these lines is drawn horizontally (e.g., the x-axis) and the other is drawn vertically (e.g., the y-axis) in the reader’s field of view. The intersection of these lines is called the origin of the coordinate system. Using the origin as the zero point, identical number lines are inscribed along each axis (See Figure 5.5).
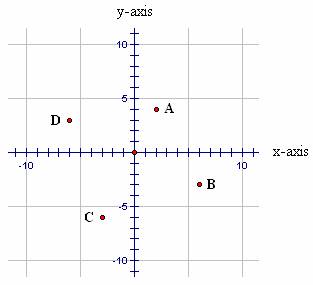
Figure 5.5: Points in the Coordinate Plane
This system provides a means for associating every point in the plane with an ordered pair of numbers, often called the coordinates of the point. For instance, in Figure 5.4 point A is located 2 number-line units to the right of the origin and 4 number-line units above the origin. This information is encoded as the ordered pair (2, 4). In this notation, the first element in the list is called x-coordinate of A and the second element is called the y-coordinate of A. Following this convention, the coordinates of points B, C, and D may be listed and differentiated from one another as B(6, -3), C(-3, -6), and D(-6, 3).
Depending on the context in which they are used, coordinates such as A(2, 4) may be viewed as in different ways. For instance, if the origin is viewed as the starting point for a journey to A(2, 4), then the coordinates may be used as “directions”: Move two units in the positive x-direction; then, move four units in the positive y-direction. The coordinates may also be viewed as “location”: Point A is located two units to the right of and four units above the origin. In other contexts, an ordered pair may express a relationship between variables that have nothing to do with either direction or location (e.g., Two rulers cost $4). Learning to represent directions, location, and other relationships in this manner is an important goal of elementary mathematics.
Example 5.1
Using the Geometers Sketchpad Plot Points option in the Graph pull-down menu, graph the points (1, 3), (2, 6), (3, 9), and (4, 12). Describe the relationship between the x-coordinates and y-coordinates of these points.
Solution 5.1
Figure 5.6 shows the points as plotted using the Geometers Sketchpad. A line has also been drawn containing the four points. This line demonstrates a linear relationship between the x-coordinates and y-coordinates of the four points.
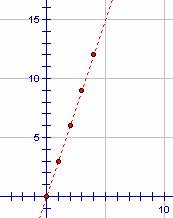
Figure 5.6: Plotting Points
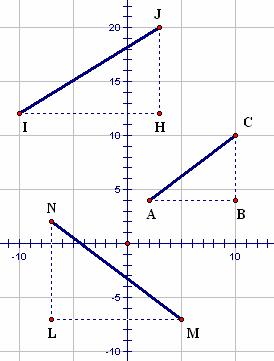
Directed activity Segment Length. In coordinate
geometry, the lengths of vertical and horizontal segments are computed easily
using the coordinates of their endpoints. For instance, in Figure 5.3,
segment a has endpoints (-6, 11) and (-6, -3).
Because the line is vertical (i.e., both endpoints are the same distance from
the y-axis), the endpoints have identical x-coordinates. The
y-coordinates of these points are different because of their different
locations relative to the x-axis. How far is it from one endpoint of
segment a to the other? The length of segment a is computed
as the absolute value of the difference in its y-coordinates: Length = ![]() . What purpose does
absolute value play in this calculation? Why is it necessary? Find
the lengths of segments b, c, and d in Figure 5.7.
. What purpose does
absolute value play in this calculation? Why is it necessary? Find
the lengths of segments b, c, and d in Figure 5.7.
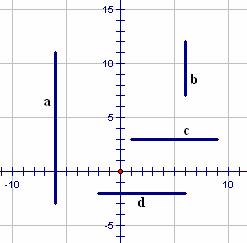
Figure 5.7: Vertical and Horizontal Distance
Example 5.2
Find the length of the segments with the following endpoints.
a. (4, 6) and (-1, 6)
b. (-2, -8) and (-2, 14)
Solution 5.2
a. Because
both endpoints have the same y-coordinate, the segment is horizontal with length
![]() .
.
b. Because both
endpoints have the same x-coordinate, the segment is vertical with length ![]() .
.
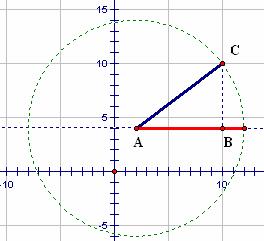
When segments are neither vertical nor horizontal, the
Pythagorean Theorem must be used to determine segment length. In Figure
5.8, segment AC may be thought of as the hypotenuse of right ΔABC.
Using the Pythagorean Theorem, AC may be computed as ![]() . Since AB is a
horizontal segment, its length may be computed as the absolute difference of
its endpoints’ x-coordinates, in this case AB =
. Since AB is a
horizontal segment, its length may be computed as the absolute difference of
its endpoints’ x-coordinates, in this case AB = ![]() . Using a similar
procedure, the length of segment BC is computed as BC =
. Using a similar
procedure, the length of segment BC is computed as BC = ![]() . Inserting these
lengths into the Pythagorean formula yields
. Inserting these
lengths into the Pythagorean formula yields ![]() This result may
be verified graphically by constructing a circle with center A and radius AC
then examining its point of intersection with the line containing segment AB
(See Figure 5.9). In this figure, the length of the hypotenuse is seen to
be two units greater than that of segment AB. Using similar procedures,
compute the lengths of segments IJ and LM.
This result may
be verified graphically by constructing a circle with center A and radius AC
then examining its point of intersection with the line containing segment AB
(See Figure 5.9). In this figure, the length of the hypotenuse is seen to
be two units greater than that of segment AB. Using similar procedures,
compute the lengths of segments IJ and LM.
In general, if a segment has endpoints A(a1, a2)
and B(b1, b2), the length of the segment is given by the
formula ![]() . Explain
this use of notation.
. Explain
this use of notation.
|
|
|
|
Figure 5.8: Using the Pythagorean Theorem |
Figure 5.9: Comparing the Length of AC and AB |
Example 5.3
Find the length of the segments with the following endpoints.
a. (4, 5) and (-1, 2)
b. (-1, -5) and (2, 3)
Solution 5.3
a. ![]()
![]()
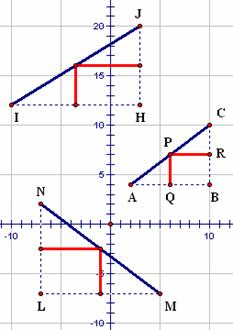
Directed activity Segment Midpoint. As
suggested by its name, the midpoint of any segment is equidistant
from its endpoints. For instance, in ΔABC (See Figure 5.10), the
midpoint of segment AC is point P, that is, AP = PC. Note that the
x-coordinate of point P is the same as the x-coordinate of point Q, the
midpoint of segment AB (i.e., AQ = QB). The coordinates of point Q may be
computed as the average of the coordinates of the endpoints of segment AB: ![]() . Likewise, the
y-coordinate of point P is the same as the y-coordinate of point R, the
midpoint of segment BC (i.e., BR = RC). The coordinates of point R are
computed as
. Likewise, the
y-coordinate of point P is the same as the y-coordinate of point R, the
midpoint of segment BC (i.e., BR = RC). The coordinates of point R are
computed as ![]() .
Combining these results, the coordinates of point P are (6, 7). You may
verify these relationships by experimenting with the Geometers Sketchpad model
5_Fig5_10.gsp.
.
Combining these results, the coordinates of point P are (6, 7). You may
verify these relationships by experimenting with the Geometers Sketchpad model
5_Fig5_10.gsp.
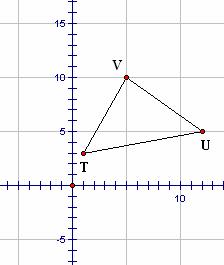
Using a similar procedure, compute the coordinates of the midpoints of segments IJ and MN. In your own words, explain why this procedure “works”. In Figure 5.11, compute and plot the midpoints of all three sides of ΔTUV. Then draw a segment connecting each midpoint to the opposite vertex. Plot the intersection of those segments and estimate its coordinates. What is that point of intersection called?
|
|
|
|
Figure 5.10: Midpoints of Segments |
Figure 5.11: Midpoints of a Triangle |
Example 5.4
Find the midpoints of the segments with the following endpoints.
a. (8, 4) and (-1, 2)
b. (-1, -5) and (3, 3)
Solution 5.4
a. 
b. 
Directed Activity Slope. The slope of
segment AC in Figure 5.10 is defined in terms of the coordinates of its
endpoints: ![]() .
The same result may be obtained using the legs of ΔABC. In this
approach, BC is called the rise and AB is called the run relative
to segment AC:
.
The same result may be obtained using the legs of ΔABC. In this
approach, BC is called the rise and AB is called the run relative
to segment AC: ![]() .
Computed either way, the slope of a segment or line is independent of the
particular points used in its calculation, as long as both points lie on the
given line. For instance, using the coordinates of endpoint A and midpoint
P, the slope of segment AC may be computed as
.
Computed either way, the slope of a segment or line is independent of the
particular points used in its calculation, as long as both points lie on the
given line. For instance, using the coordinates of endpoint A and midpoint
P, the slope of segment AC may be computed as ![]() .
.
Example 5.5
Find the slopes of the segments with the following endpoints.
a. (8, -4) and (-1, 2)
b. (-1, -5) and (3, 3)
Solution 5.5
a. 
b. 
Depending on its orientation in the plane, a line or segment may have a slope that is positive, negative, zero, or undefined (See Table 5.1).
|
Numerical Value |
Graphical Example |
Description |
|
Zero |
|
Given two points on a horizontal line, |
|
Positive |
|
Given two points on a line rising from left to right, |
|
Negative |
|
Given two points on a line decending from left to right, |
|
Undefined (no slope) |
|
Given two points on a vertical line, is undefined. |
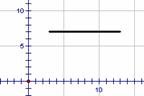
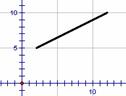
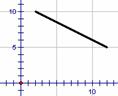
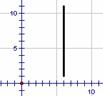
Table 5.1: Slope Values
In Figure 5.12 segment AC is drawn parallel to segment
BC. The slopes of these segments are computed as![]() . Note that the slopes
of both segments are 3/8. In general, the slopes of parallel segments or
lines are identical and the slopes of intersecting lines are different.
Consequently, the question of whether two lines are parallel or intersecting
may be answered by comparing their slopes.
. Note that the slopes
of both segments are 3/8. In general, the slopes of parallel segments or
lines are identical and the slopes of intersecting lines are different.
Consequently, the question of whether two lines are parallel or intersecting
may be answered by comparing their slopes.
Example 5.6
Segment AC has endpoints (8, 1) and (-5, 14). Segment BD has endpoints (0, 4) and (5, -1). Are these segments parallel or do they intersect?
Solution 5.6
The slope of segment AC may be computed as ![]() . The slope of segment
BD may be computed as
. The slope of segment
BD may be computed as ![]() .
Since the slopes are identical, the segments are parallel.
.
Since the slopes are identical, the segments are parallel.
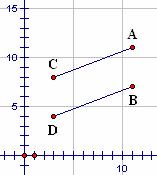
Figure 5.12: Slopes of Parallel Segments
In Figure 5.13, segment AC is drawn perpendicular to segment
BC. The slopes of these segments are computed as ![]() and
and ![]() . Multiplying these
slopes yields
. Multiplying these
slopes yields  .
.
Using the Geometers Sketchpad model 5_Fig5_13.gsp, you may manipulate the orientation of the right angle in the plane. In each case, however the slopes may change, their product remains constant as long as neither of the slopes is undefined. This finding is usually expressed as follows: If two perpendicular lines have slopes m and n, the product of their slopes equals negative one. Alternatively, this relationships may be written as m = -1/n. In this form the relationship may be stated as follows: The slopes of perpendicular lines are negative reciprocals of one another.
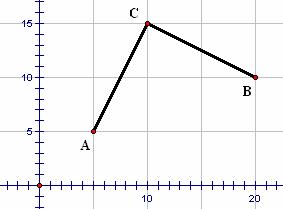
Figure 5.13: Slopes of Perpendicular Lines
Example 5.7
a. Line m has slope -1/3 and line n has slope -3. Is line m perpendicular to line n?
b. Line m has slope -2/5. If line n is perpendicular to line m, what is the slope of line n?
Solution 5.7
a. If two
lines are perpendicular, the product of their slopes equals -1.
Since  , the
lines are not perpendicular.
, the
lines are not perpendicular.
b. If two lines are
perpendicular, their slopes are negative reciprocals. Since the slope of
line m is -2/5, the slope of line n is computed as  .
.